Tom R. Leppard, PhD

I am a father, a Londoner, a former rugby player, and a postdoctoral scholar for the Data Science and AI Academy at North Carolina State University.
Visualising Grime
About | Research | Teaching | Network Tutorials | CV | Visualising Grime
For my dissertation, I studied the collaboraitons between Grime musicians. Grime is a UK-based rap genre that emerged from the east London reggae and Garage scene in the early 2000s. Broadly speaking, my dissertation investigated how network embeddedness is assciated with the career success of 122 Grime artists. I codded their collaborations with others in the sample on Spotify over a 22 year period (2001-2022). From this, I generated directed networks for each year. An outward connection represents artist A appearing on artist B’s Spotify profile (working on B’s songs). An inward connection represents B featuring on A’s profile (featuring on their songs). Here is a small collection of various visualisations I have created to showcase some of my work on this genre of music. Some of the visualisations are interactive and will need to be opened as links.
Grime in 3D - Interactive
Communities of Atists
I ran some community detection on collaborations each year and related artists, here is a network of communities of artists who share listeners (click to move and scroll in and out). To get the related artists, I used Spotifyr’s “get_related_artists” function to obtain the artists that the listeners of these 122 artists also listen to. I then visualised this as network to artsts are connected to related artists.
Group Synthesis Measure
This is another interactive networks from a few years of the genre (click to move and scroll in and out).
The colours of the nodes in this network represent a unique measure of synthesis I developed in my dissertation. Blue spheres represent “Active Ego Ties” — artists whose collaborations mostly appear on other artists’ profiles, meaning they have more outward connections than inward. Green spheres represent “Active Alter Ties” — artists who receive more collaborations than they give, meaning they have more inward connections than outward. Purple spheres represent “Mutual Ties” — artists who give and receive collaborations in equal measure, maintaining a balanced exchange. Red spheres represent artists who have never collaborated with anyone in the network.
I used a cumulative version of this measure where I measured their interactions from 2001-2022. This interactive plot shows the dynamism of the artist-to-genre attachment demonstrating that a group is constructed by multiple indviiduals with various forms of membership. Double click to legend to toggle lines and hover over points for more info.
Grime Collaborations Overtime
This is an ndtv network movie depicting the collaborations of Grime artists over the 22 year period I observed. For this visual, I removed isolated artists from each year. You need to press the play button on the bottom right. You can alter the speed at which the network chances by using te settings on the top right.
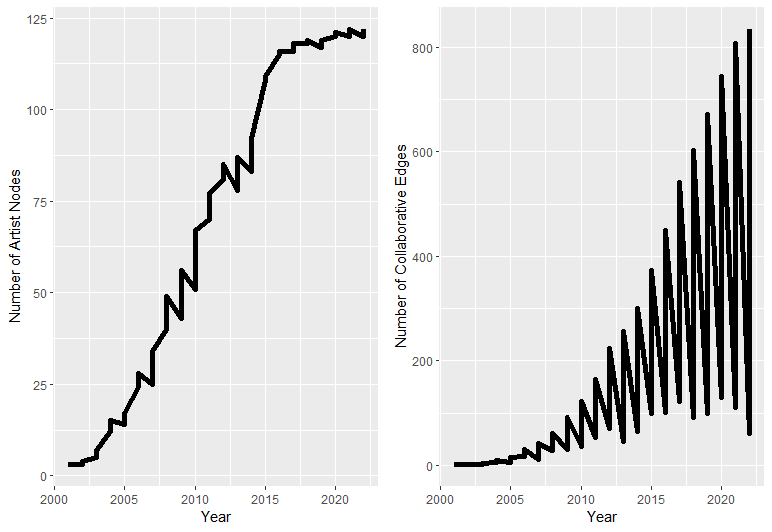
Grime Network Measures Overtime
These line graphs illustrate the growth of Grime networks in terms of order (number of nodes) and size (number of edges). While there is a consistent increase in order, the size fluctuates more erratically. These indicate a steady expansion of the genre itself but a more erratic pattern in the collaborative connections between artists.